Building a Test Fixture to Measure the Optical Path Length Difference of Mach-Zehnder Interferometers


The iPhone Junk Drawer
When I was an engineering intern at Meniscense, a life sciences startup for liquid volume measurement, most of my responsibilities centered around process improvement. The company was gearing up for full-scale production and, as a result, they were looking for ways to save time and money when assembling instruments, without sacrificing quality or performance.
The largest bottleneck identified was caused by the four Mach-Zehnder interferometer boxes used in every instrument, a crucial components to the instrument's function. These interferometers were purchased from a vendor who was supposed to manufacture the part to the drawing specification. Unfortunately, three simultaneous problems were occurring:
- Many of the boxes purchased from the vendor did not meet the required drawing specifications.
- Boxes that didn’t meet specification were a huge resource sink in terms of hours spent testing and wasted material.
- Validating a box required the use of a full instrument. If an instrument was being used to test the interferometer boxes, that meant it couldn’t be used elsewhere.
The test went as follows: place a box into an instrument. If the box didn't appear to work at first, troubleshoot for hours. Once every possible reason for failure was exhausted, put the box in the "unusable" bin. With no quantitative proof of non-conformance, it was incredibly difficult to get a corrective action from the vendor.
This was a tremendous waste of time and money. Consider that each box cost around $2,500. That’s equivalent to buying a bunch of iPhones and letting the ones that don't turn on collect dust. The problem was that we had no way to prove the boxes were out of spec. This is why I built a custom test fixture as a solution.
What’s in the Box?
Each interferometer is a box with four fiber optic ports. For testing purposes, a near-IR (infrared) laser is fed into the “Com 1/99" port. The signal is split by a beam splitter. From there, 1% of the light goes to the “Out 1%” port through a second beam splitter, and 99% of the light goes to the “Out 99%” port through a third beam splitter. Any signal fed back into those two ports is recombined with a final beam splitter and exits the “Com 50/50” port. While the diagram below makes this look neat and orderly, if you were to open one of these boxes you would find a fragile, tightly wound mass of fiber optic cable.
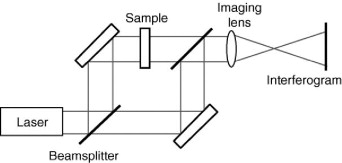
The non-conformance occurs when these two fiber optic cables aren’t within a certain optical length of each other. A too-large difference in cable length renders the box unusable for the instrument. Because the cables inside are so tightly wound and easily breakable, there’s no way to quickly and safely measure this property using standard measurement tools. Even if you tried, there’s a high risk of breaking the assembly. A custom test fixture was required.
Building the Test Rig
So, how does one build a test fixture to measure the path length difference inside a literal and figurative black box? It’s quite simple, actually.
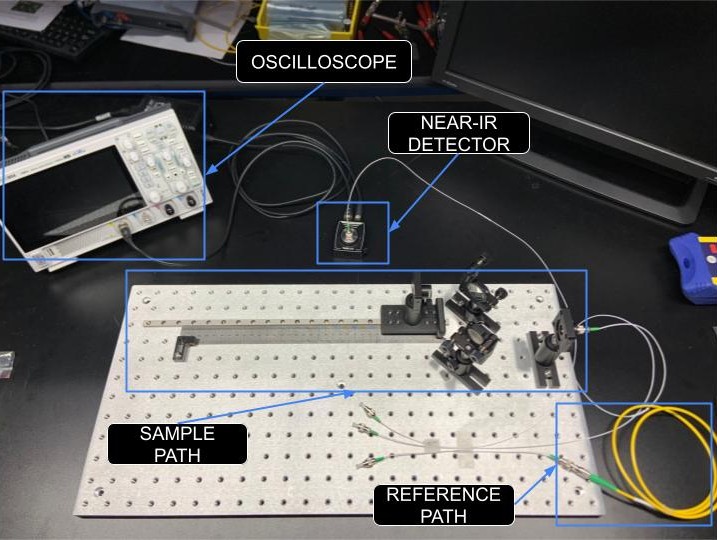
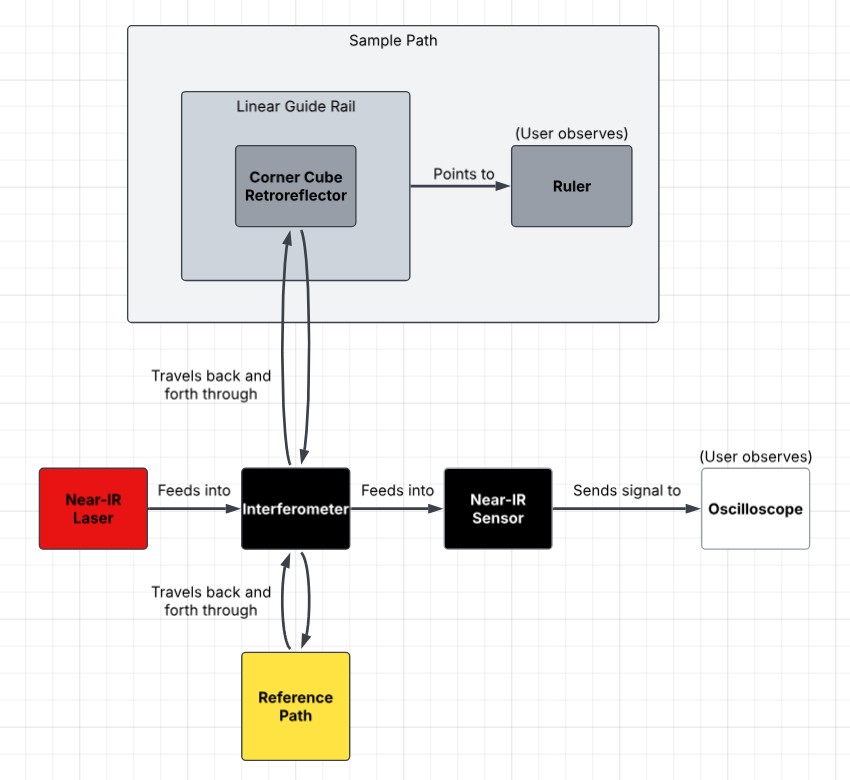
You start with an optical breadboard plate the weight of a small child. A near-IR laser is shone through a fiber optic cable into the “Com 1/99” port of the interferometer attached to the test fixture. The “Out 99%” port is attached to the sample path. The sample path is projected through open air and, using mirrors, is aligned towards a corner cube retroreflector.
A corner cube retroreflector (CCR) is an optical component that bounces a beam parallel to the input beam, but in the opposite direction. This CCR is mounted to a linear guide rail using a custom-designed 3D-printed adapter. A ruler is secured next to the linear rail. The 3D-printed adapter has a measurement guide off to the side which points to the ruler.
The beam is reflected from the CCR back into the “Out 99%” port. The “Out 1%” port is attached to the reference path, a fixed-length cable with a mirror at the end. The mirror sends the signal back into the “Out 1%” port. The recombined signal exits the “Com 50/50” port into a near-IR sensor. The sensor is hooked up to an oscilloscope, which displays the sensor’s voltage.
A Light Explanation
The purpose of the test fixture is to measure one property of the interferometer box: the difference between the two cables’
After the user plugs a box into the rig, they move the CCR on the sample path until an interference pattern shows on the oscilloscope. This indicates that the two paths are the same optical length. The user then swaps the ports the sample and reference paths are connected to. If the sample path was originally attached to the "Out 99%" port and the reference path to the "Out 1%" port, the user swaps them so the sample is on 1% and the reference is on 99%.
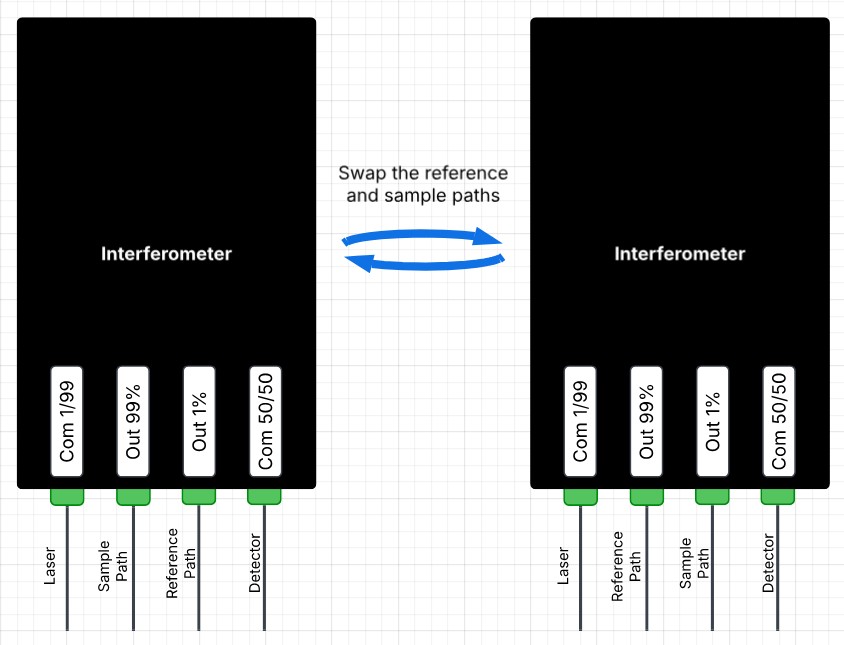
Once again, the user finds where the beams achieve the same optical path length by moving the CCR along the linear guide rail until an interference pattern spikes on the oscilloscope screen. The ruler next to the linear guide rail is used to record the two points at which the interference pattern appears.
Now that the two points are found, calculating the difference in optical path length (OPL) works out nicely through a system of equations.
Define the optical path length difference:
System of equations (equal optical path lengths at the two interference patterns):
Simplify by substituting the the optical path length difference equation:
Subtracting the system of equations:
So the difference in optical path lengths turns out to be:
Because the refractive index of air is 1 we can simplify to:
For example, if
is , that means the 99% cable is optically longer than the 1% cable. If the is , the 99% cable is optically shorter than the 1% cable.Results and Outcomes
The fixture enabled us to test the backlog, as well as any new orders, in a timely and accurate manner. That meant no more guessing and checking.
The most important outcome of this project was gaining quantitative evidence that the interferometers were out of spec, providing clear justification for getting refunds from the vendor. It took just 10 to 15 minutes to test an interferometer box on the test fixture, saving $2,500 and up to 8 hours of troubleshooting per non-conformance. Furthermore, it modularized our ability to test the interferometer boxes, meaning they no longer required a fully built instrument to validate each one.
How This Process Could be Automated
There are several improvements that could be made to the test fixture to automate the process, increase item throughput, and prevent human error.
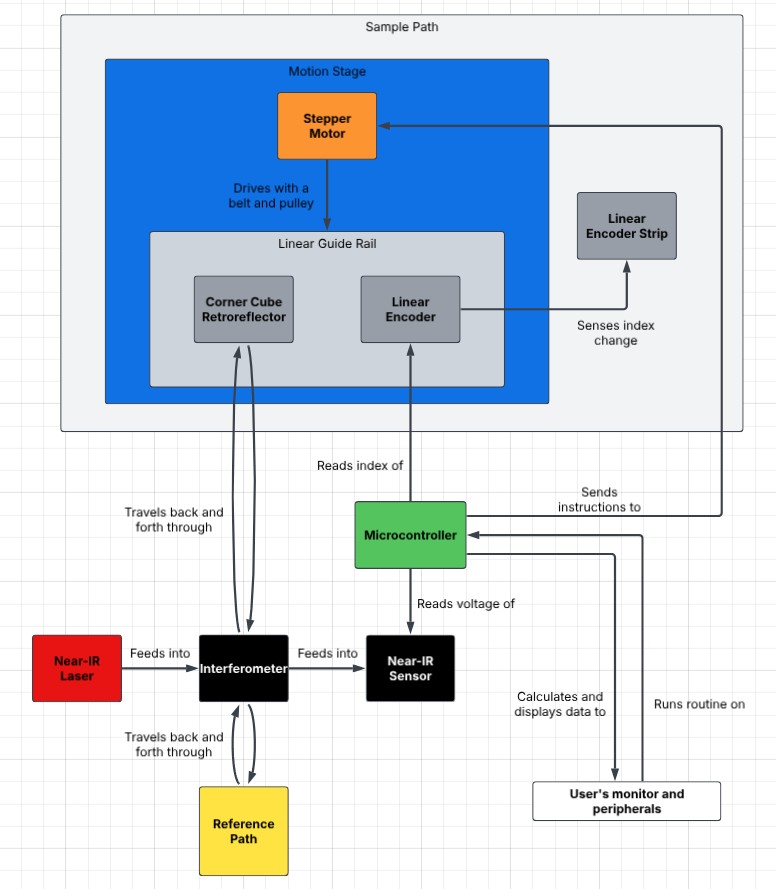
The first step would be taking the measurement automatically using a linear encoder rather than by eye with a ruler. The linear encoder would move with the linear guide rail and send the step count to a microcontroller, which would convert that index to a physical measurement. This would provide a precise measurement down to the tens of micrometers.
A second step would be to add motion control to the linear guide rail by implementing an open-loop stepper motor and belt. We would rely on the linear encoder to measure location, rather than a closed-loop stepper motor, since the belt may lose tension and create drift in the measurement.
With these implementations, we could now do something cool. The interference pattern picked up by the near-IR sensor allows us to measure when the optical path lengths match. We could run a routine with the microcontroller that moves the linear guide until the first interference pattern shows. This signals the stepper motor to halt while the microcontroller records the absolute index of the optical sensor along the magnetic tape. Then, once the user swaps the inputs, the stepper motor and belt move the linear guide again until the second interference pattern shows. Once again, the stepper motor halts, and the microcontroller records the absolute index of the second position.
It doesn’t actually matter what the two absolute indices are relative to, because the only measurement that we need is the index difference between the two points. Using the lines per unit distance of the linear encoder strip, the index difference, and our equation from earlier, the value is scaled to the optical path length difference.
Scale the index difference to the optical path length difference:
Steps For Quality Control
As far as quality control goes, this test fixture excels at testing the interferometer boxes and providing quantitative evidence for non-conformances. This left Meniscense’s internal quality control for the boxes in a highly satisfactory place.
That being said, steps must be taken to ensure the vendor is producing the interferometers to the drawing specs. Here are some ways to ensure that the onus for quality remains on the vendor:
- Require a certificate of analysis with every order. This provides the paperwork to hold them accountable.
- Hand an identical test rig off to the vendor so they can pass/fail the interferometer boxes themselves. If the vendor is willing, this provides an incentive to further automate the test fixture and make it more user-friendly.
- Update the purchase agreement to have the vendor absorb the cost of any failed items. A financial incentive is often the best incentive.
Footnotes
- Optical path length is different from physical length. Light moves at different speeds through different materials, and optical path length normalizes the length measurement based on what material(s) the light travels through. The equation for optical path length is , where is the refractive index (a dimensionless quantity) and is the physical length.
- For a optical path length difference through a fiber-optic cable where the refractive index of the cable is , the actual, physical path length difference is since .
Table of Contents


